Smart Energy Monitoring System
By placing intelligent smart energy meters at every key consumption point in a facility, we create a complete, always-on picture of how electricity moves through your infrastructure and an AI engine that tells you what to do about it before the bill arrives.
The Problem With Conventional Energy Management
Anomalies go undetected for weeks. Inefficient equipment runs unchallenged for months. Preventive maintenance is scheduled by calendar, not by actual equipment condition. Energy budgets are managed by assumption rather than data.
Smart Energy Monitoring replaces all of that with continuous, granular, AI-driven intelligence.
How It Works
Smart energy meters installed at key consumption points across the facility machines, production lines, HVAC systems, lighting circuits, utility feeds capture electrical parameters continuously. Voltage, current, power factor, active and reactive power, harmonics, and consumption measured in real time, at every point, every moment of the day.
Nothing is estimated. Nothing is aggregated before it reaches the system. Every consumption event is captured at source.
All meter data feeds directly into a machine learning and AI prediction engine that does three things simultaneously:
Detects anomalies — the moment a machine draws more power than its baseline, the system flags it. Not at the end of the month. Not at the end of the day. At the moment it happens.
Predicts failures — by analysing consumption patterns over time, the AI identifies equipment trending toward failure before it breaks down — enabling maintenance intervention before an unplanned shutdown occurs.
Identifies inefficiency — the engine continuously compares actual consumption against optimal benchmarks, surfacing equipment that is consuming more energy than it should for its current output level.

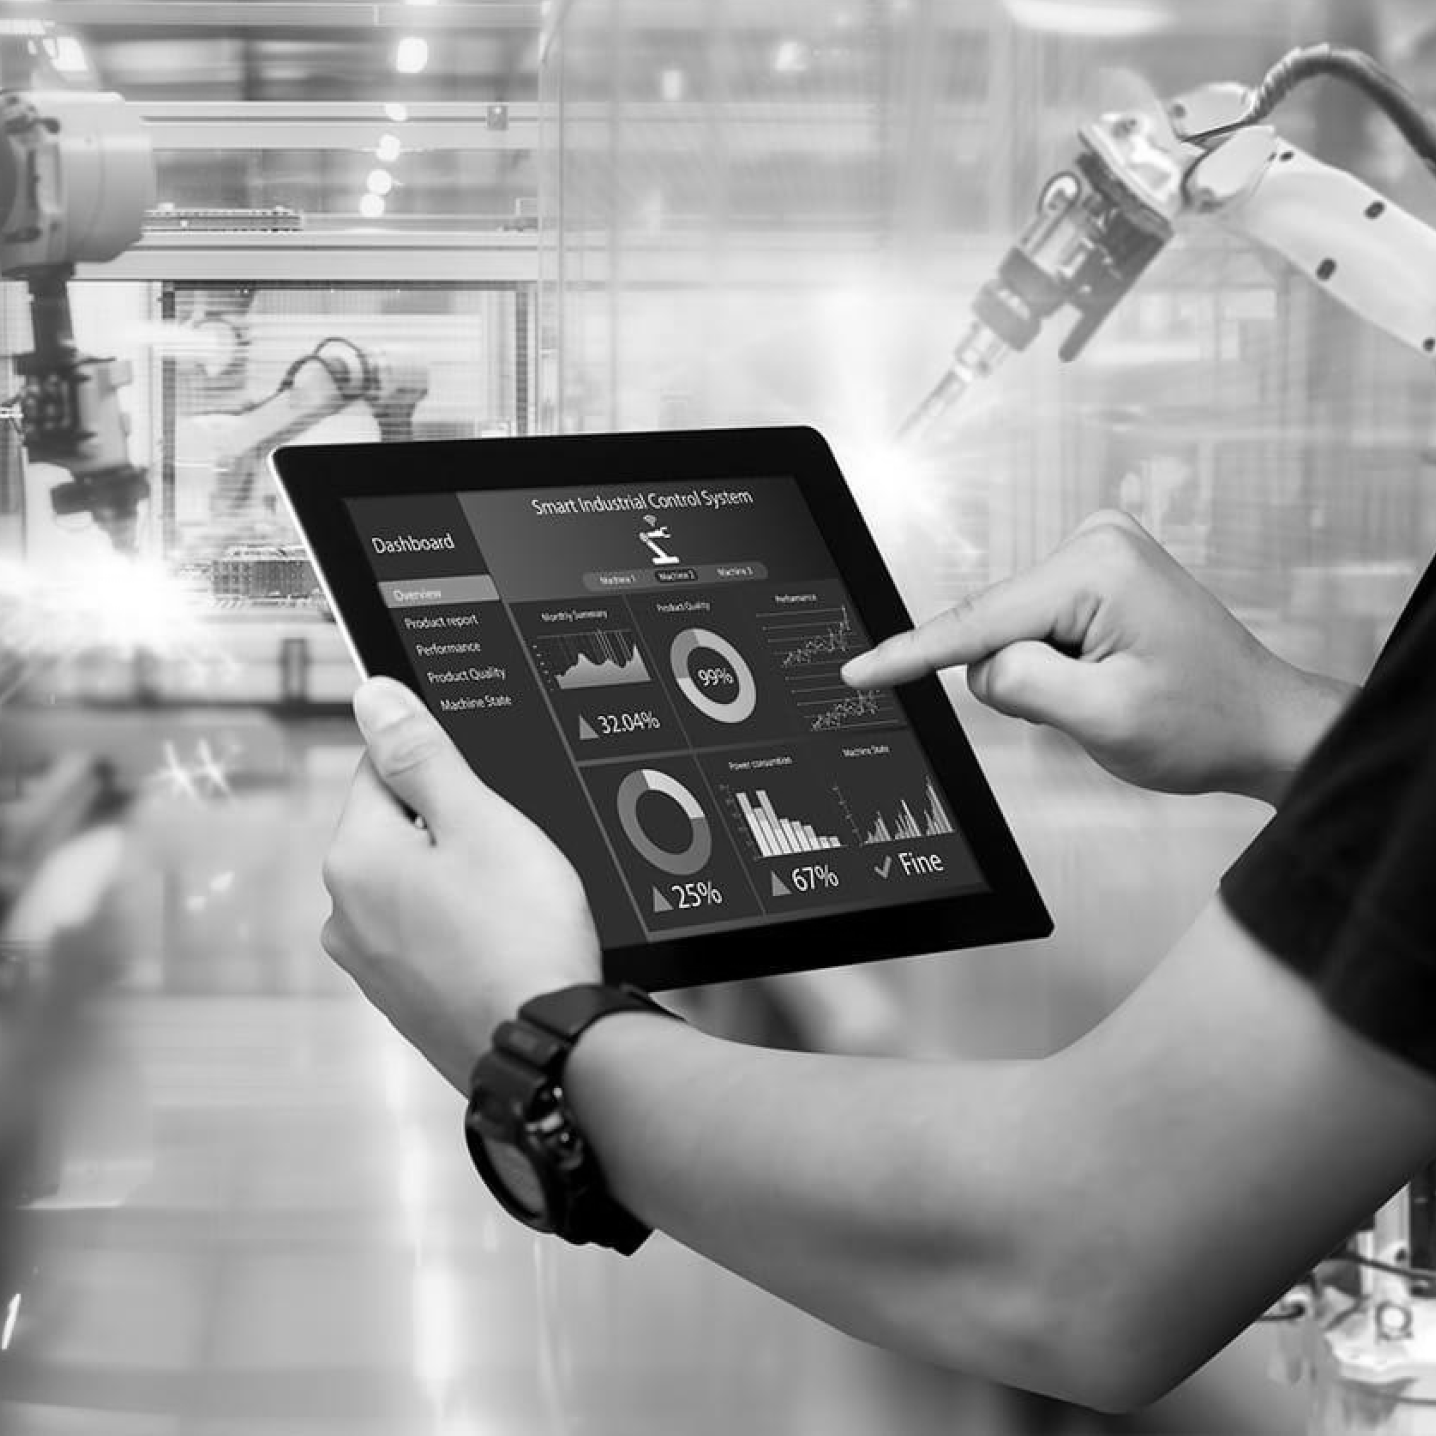
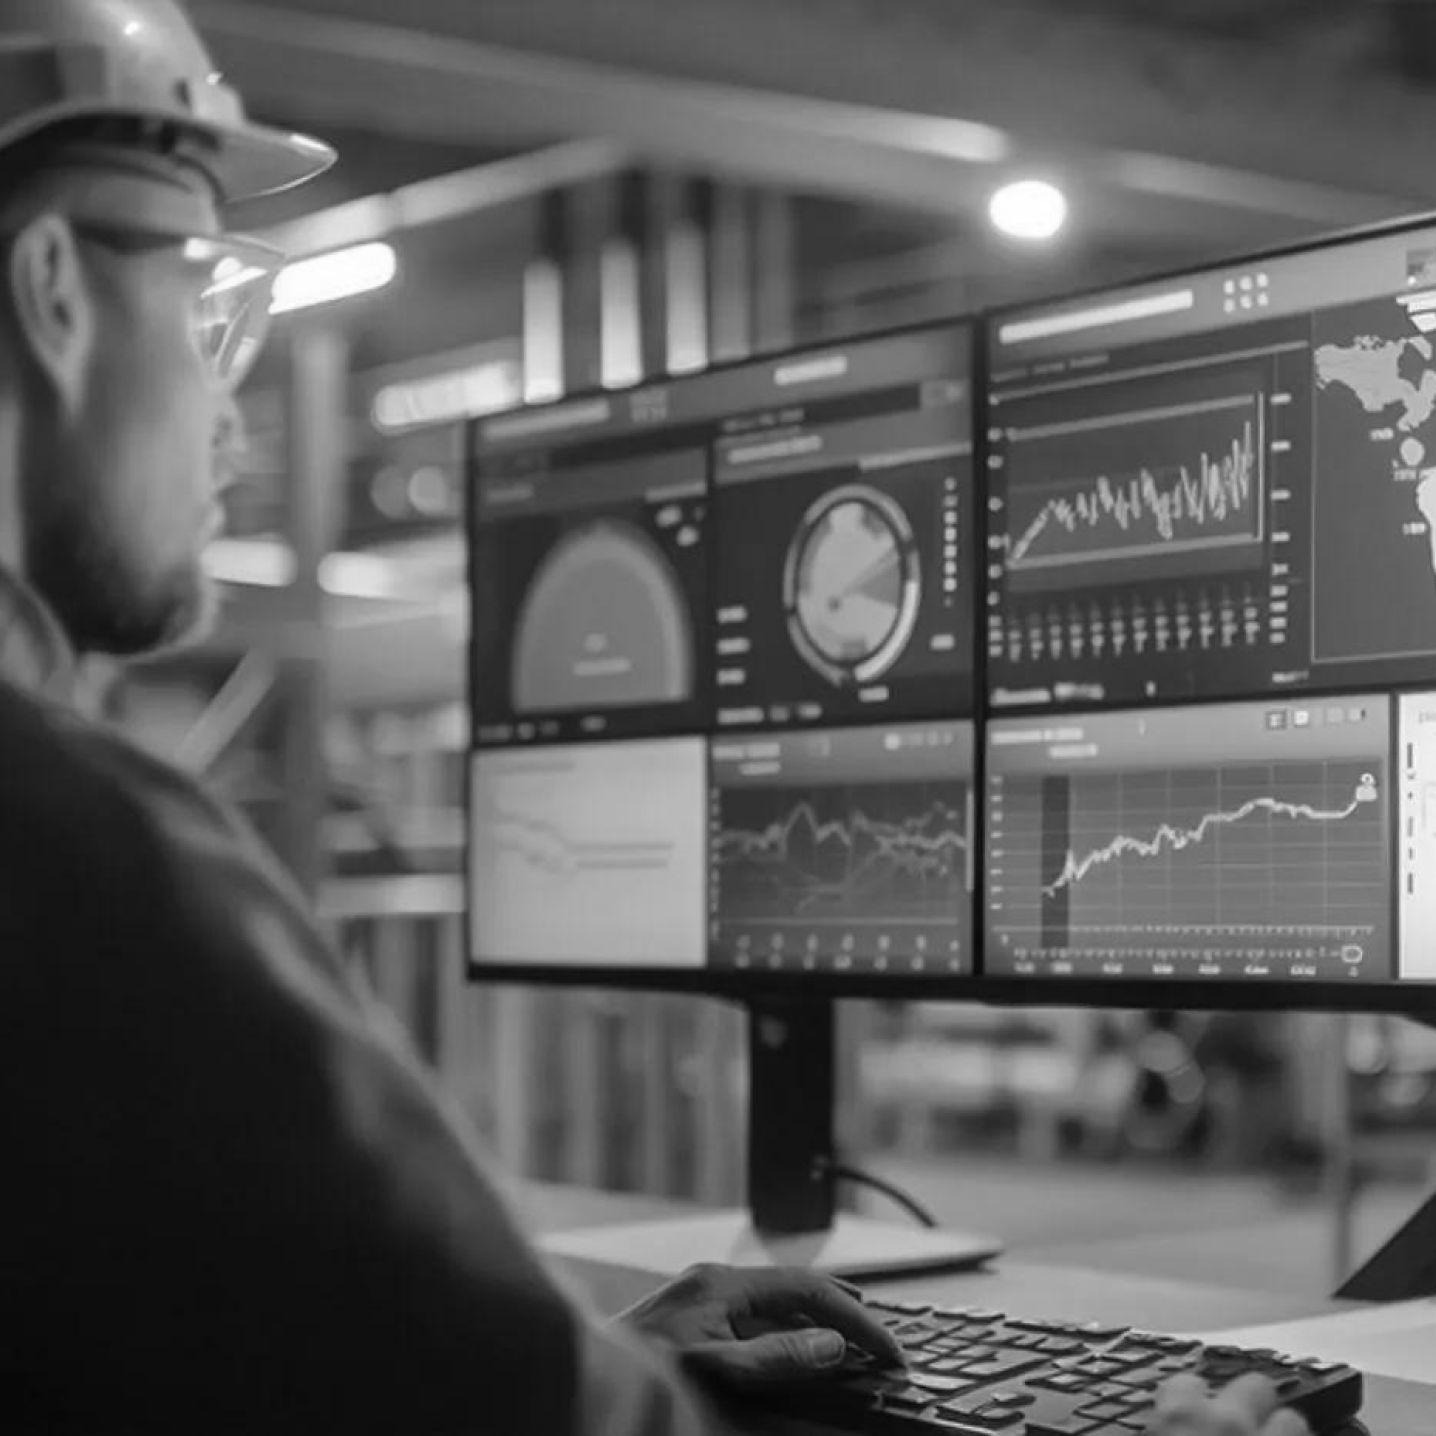
BI Dashboards — Consumption Intelligence at a Glance
What the dashboards show:
- Real-time consumption across every monitored point simultaneously
- Product-wise and machine-wise consumption comparison — identifying which equipment delivers the best energy-to-output ratio
- Shift-wise and time-of-day consumption patterns — revealing when and where peak consumption occurs and whether it is justified by production output
- Anomaly tracking with root cause identification — not just flagging that consumption spiked, but showing which equipment caused it and why
- Trend analysis — week-on-week, month-on-month, and year-on-year consumption benchmarking for continuous improvement tracking
- Cost attribution — translating energy consumption data into actual cost by machine, by shift, by production run
What This Delivers
Preventive Maintenance — Before Breakdown - Excess power draw is one of the earliest indicators of mechanical degradation. The AI engine catches it before it cascades into equipment failure — reducing unplanned downtime and extending equipment operational life.
Cost Reduction Without Production - Impact Energy optimisation does not require reducing output. It requires running equipment at the right efficiency level. By identifying and correcting inefficiency at machine level, facilities reduce energy spend without touching production targets.
Accountability at Every Level - When every consumption point is measured and visible, energy accountability moves from the finance department to the production floor where the decisions that drive consumption are actually made.
Data-Driven Procurement Decisions - Product-wise and equipment-wise consumption comparison gives procurement and operations teams the data to make evidence-based decisions about equipment replacement, upgrade, and retirement replacing gut-feel with measured efficiency benchmarking.

Key Capabilities at a Glance
- Continuous real-time measurement at every key consumption point
- AI and ML prediction engine — anomaly detection, failure prediction, efficiency analysis
- BI dashboards — machine-wise, product-wise, shift-wise consumption visualisation
- Root cause analysis for consumption anomalies
- Automated SMS and dashboard alerts on anomaly detection
- Preventive maintenance triggers based on consumption pattern deviation
- Cost attribution by machine, shift, and production run
- Trend analysis and benchmarking week, month, year
- Scalable single facility to multi-site enterprise deployment
- Edge-to-cloud data architecture continuous uptime, centralised intelligence
Where Smart Energy Monitoring Applies
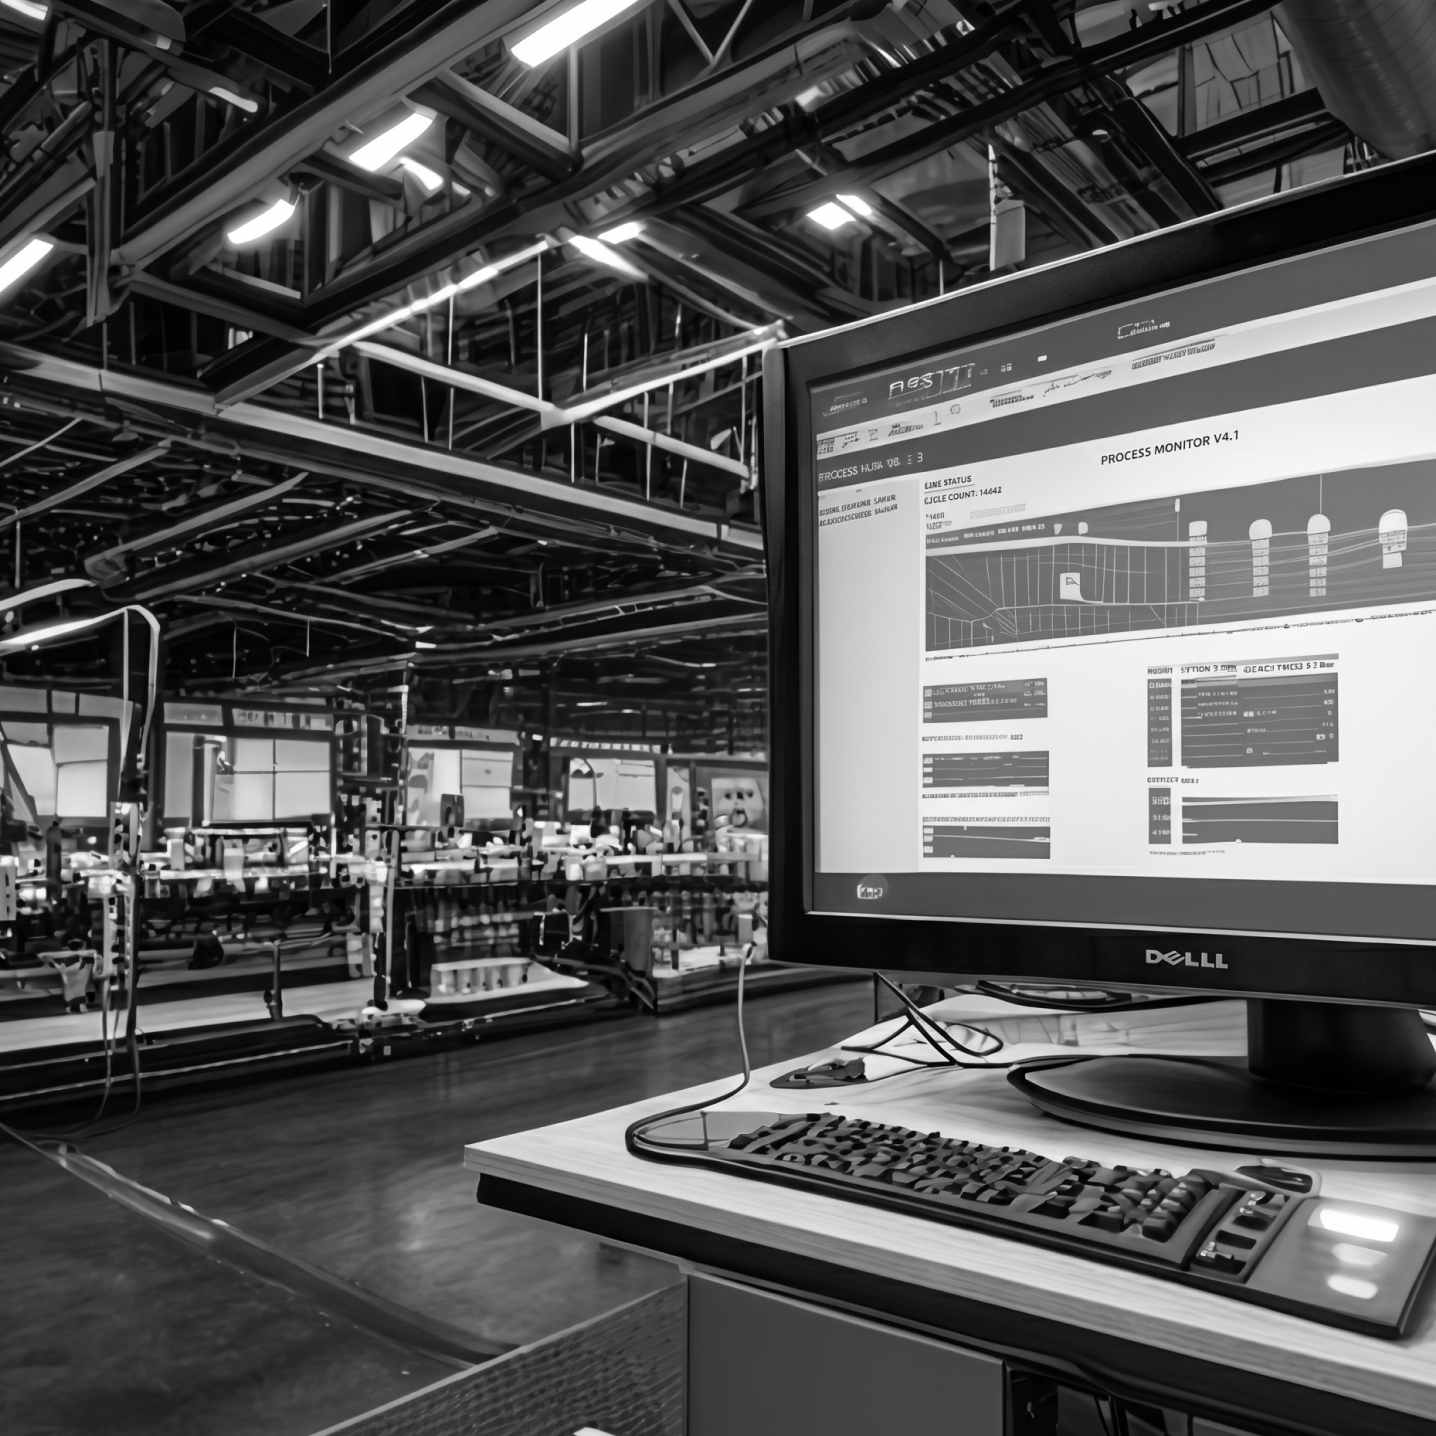
- Manufacturing and industrial facilities
- Government and institutional buildings
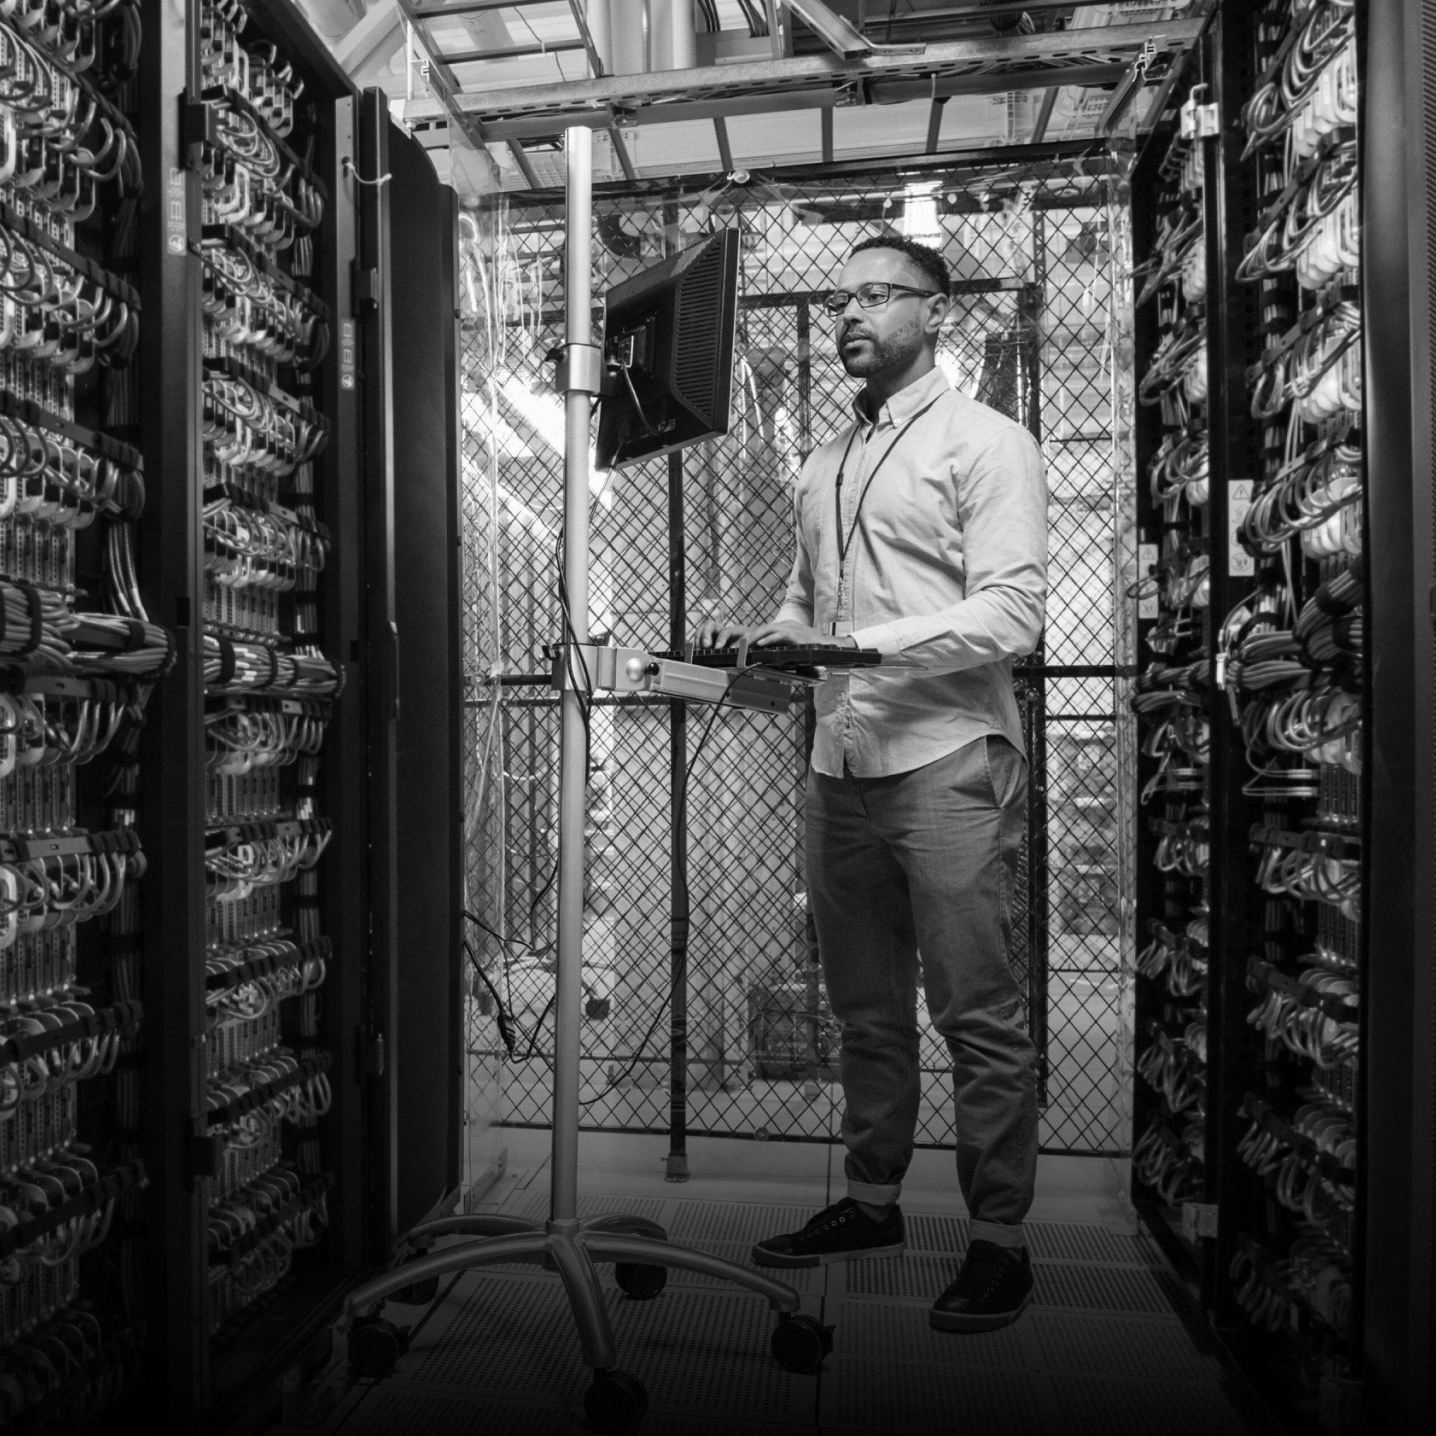
- Data centres and server infrastructure
- Hospital and healthcare facilities
- Educational campuses and smart city infrastructure
- Defence establishments and operational bases