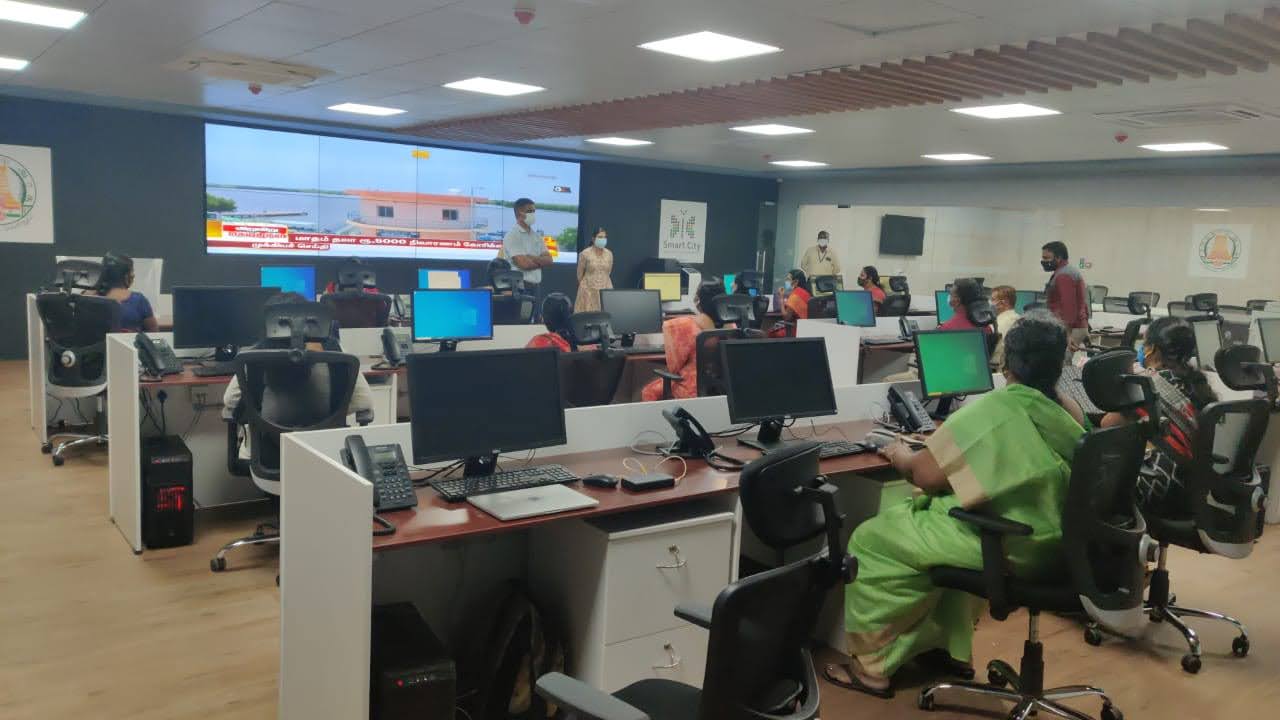
ICCC Room Video Wall Dashboard

  • The Customer

    Smart city initiative is a revolutionary project initiated by the Government of India to transform the country’s urban landscape. We had the opportunity to provide our services to the smart cities initiative in Coimbatore and Vellore through the mission directorate for the implementation of smart cities in the state of Tamil Nadu under TUFIDCO (Tamilnadu Urban Finance and Infrastructure Development Corporation Ltd)

  • The problem

    Following our services to deploy a suite of technologies in the smart city project, Smart city initiative needs a central command and control centre to oversee all the city operations in a unified platform.

image

The Solution

Video wall
Establishing a command-and-control centre with a large video wall wherein various modules to control the city operations can be accessed.
Mobile CCC
An MCCC is a vehicle-based command and control unit that usually consists of a surveillance system and remote transmission capability. This dashboard depicts the number of incidents occurring in a graphical representation and the status of various mobile CCC vans across the city along with the number and percentage of high priority incidents.
Central Dashboard
Creating a central dashboard that gives the overview of all systemic components and analytics on usage data of various modules,
Surveillance
The centralised dashboard gives an overview of overall systematic components of the Surveillance Module. It comprises a graphical representation of the number of incidents that occur every day in a particular region, as well as the information on working status of cameras. The dashboard highlights important features as high priority alarms in both numerical and percentage formats.
Safety
The dashboard depicts the number of incidents reported through the emergency box using a line chart, the working status of the boxes across the city, along with the number of high priority incidents for quick information. Percentage of the active emergency boxes and high priority alerts is included for easier understanding.
Network Management
Network management module gives the internet usage statistics of the people in the city. This dashboard totals network usage through various routers along with the status of the router device. The average usage of network bandwidth is represented in the form of a tile.
Public Announcement Systems
PA system screen shows the number of announcements made to the public and is visualized in the form of a graph on a daily basis. It also notifies about the working status of PA systems across the city.
Environmental Sensors
This dashboard shows the data collected from the rain gauge sensors in the smart poles in the form of a line graph. It also highlights the working status of the sensors and average rainfall across the city through tiles.
Heat map
The dashboard represents the distribution of alarm systems, PA systems and smart poles across the city in the form of a heat map. It also shows in the form of a heat map, the occurrence of high priority incidents across the city.
Alarms
Alarms are integrated into the system for alerting various scenarios like an intrusion in restricted areas, detecting number plates in case of any accidents or violence in some areas. This dashboard gives a segregated view on the number of events labeled from low to high priority incidents.
Mobile CCC tracking
An MCCC is a vehicle-based command and control unit that is mobile and positions itself based on any given situation. This screen capture depicts the route that mobile vans have taken on a particular day.
City Lights
The smart lighting module represents the working status of the smart lights across the city. The dashboard also gives data analysis on energy consumed by the city lights everyday.
Benefits
Improved urban quality of life

Live information on city happenings to the citizens including important events, weather, accidents and emergency notices in times of calamities help people plan accordingly.

Overview of city operations

Get control over city operations by monitoring them through a single dashboard. Allows the city government to better respond to its citizens.

Increased public safety

Deploying a surveillance system integrated with computer vision potentially reduces fatalities like homicide, fires, and road traffic by 10%. Further, incidents of assault, burglary, auto theft, and robbery could be lowered by 40%. The benefits of these metrics, of course, is the peace of mind and freedom of movement they would give city residents.